Statistical Analysis
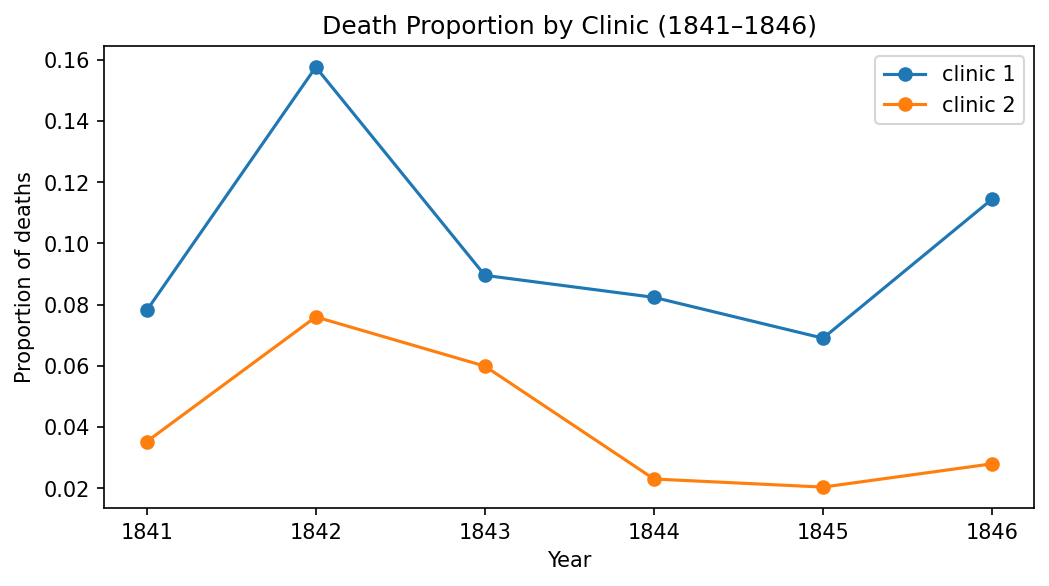
Proportion of Deaths: Clinic 1 vs Clinic 2 (1841–1846)
| Year | Clinic 1 (proportion) | Clinic 2 (proportion) |
|---|---|---|
| 1841 | 0.0781 | 0.0352 |
| 1842 | 0.1576 | 0.076 |
| 1843 | 0.0895 | 0.0599 |
| 1844 | 0.0824 | 0.023 |
| 1845 | 0.069 | 0.0204 |
| 1846 | 0.1145 | 0.028 |
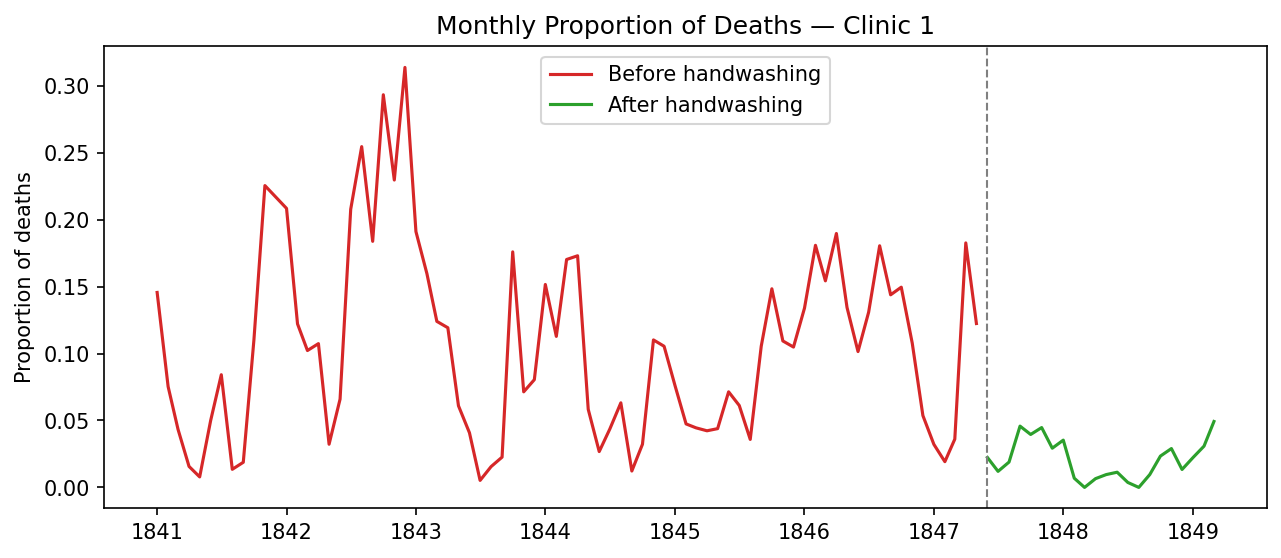
Monthly Proportion of Deaths (Clinic 1)
Mean before washing
0.105
Mean after washing
0.0211
Mean difference
-0.084
Handwashing reduced the proportion of deaths by approximately -0.084 (absolute).
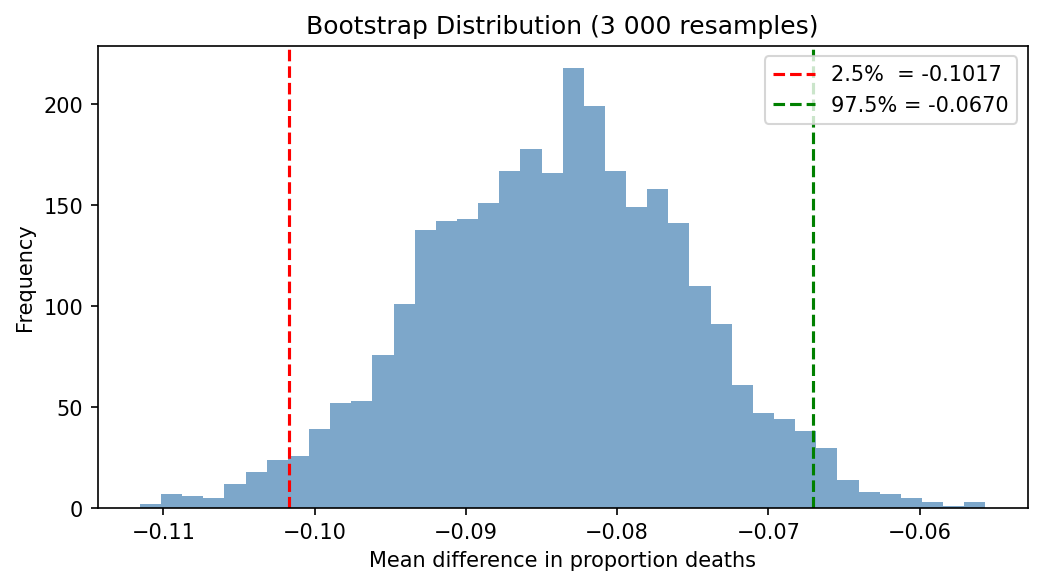
Bootstrap 95 % Confidence Interval (3 000 resamples)
Lower bound (2.5 %)
-0.1017
Upper bound (97.5 %)
-0.067
With 95 % confidence, handwashing reduced the monthly death proportion by between 10.17% and 6.7% (absolute reduction).
Welch's t-Test: Before vs After Handwashing
t-statistic
9.6101
p-value
1.45e-15
✅ The difference is statistically significant (p < 0.05).
Handwashing provably reduced mortality.
Conclusions
- Clinic 1 (medical students performing autopsies) had consistently higher death proportions than Clinic 2 (midwife students) from 1841–1846.
- After Semmelweis mandated handwashing in June 1847, deaths fell by roughly -0.084 in absolute proportion.
- Bootstrap 95 % CI: [-0.1017, -0.067] — equivalent to a 10.17–6.7 percentage-point reduction.
- Welch's t-test: t = 9.6101, p = 1.45e-15. Result is statistically significant.
Clinic Comparison Table
| Year | Clinic 1 (proportion) | Clinic 2 (proportion) |
|---|---|---|
| 1841 | 0.0781 | 0.0352 |
| 1842 | 0.1576 | 0.076 |
| 1843 | 0.0895 | 0.0599 |
| 1844 | 0.0824 | 0.023 |
| 1845 | 0.069 | 0.0204 |
| 1846 | 0.1145 | 0.028 |